

 Is there a mathematical formula for predicting a “good” airfare price? I doubt it, but that hasn’t stopped many from trying. The latest effort on this front comes from Adobe Systems, which last week announced its version of the numbers. Bloomberg reports:
The Silicon Valley company, which sells marketing and analytics software, says it detected a correlation between ticket price and total flight distance after scanning tickets sold in the first quarter of this year, allowing it to “reverse engineer” what a reasonable average fare would be on any given route.
And so, despite repeated evidence that trip distance and fare are not actually tied together, we have numbers to work with. For a domestic flight, Adobe says the roundtrip price should be $230 + 3.2 cents per mile flown; international flights are $200 + 8 cents per mile flown. The company then provides a chart showing this correlation (though conspicuously lacking in specific numbers). Sure, the numbers are close from time to time, but really do not provide a strong correlation to the formula.
And there’s good reason for that. Fares are not dependent on trip distance. Airline costs are partially tied to this factor, but competition and demand are significantly more relevant than distance, something easy to observe by actually looking at fares across markets.
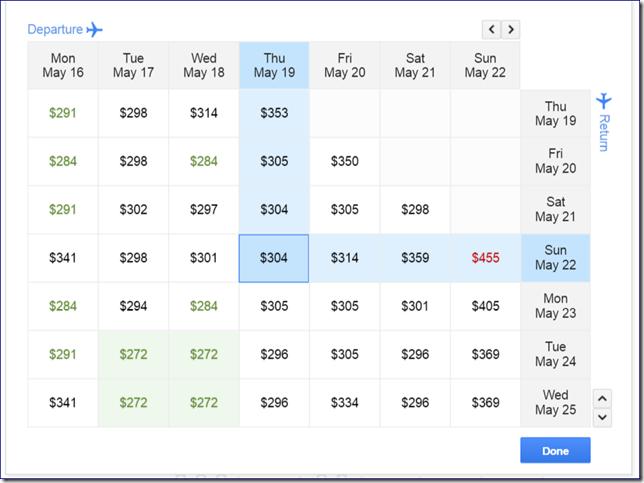
Screen grab from Google Flights just shows the variable airfare pricing.
There is lots of competition in the NYC-Los Angeles market, for example, so much that the ~$400 threshold for a “good deal” – per Adobe’s formula – comes in much higher than the somewhat broadly available <$300 fares, assuming a passenger has flexibility. New York to London is similarly competitive with many flights and airlines available, though not sufficiently so to see any fares today in Adobe’s “good deal” range of ~$760 return. Fares to and from Brazil are spectacularly cheap right now as airlines struggle to adjust capacity to meet the dropping demand of a collapsing economy. Trips of similar distance to Argentina, Chile or Uruguay are not nearly as affordable on average. Because fares really aren’t based on distance.

Adobe does call out a data point somewhat obvious to those who pay attention to the market: fares start to increase significantly at 20 days or less from travel. But the company skips the ‘why’ part of the explanation. Airlines often have a 21-day advance purchase requirement for their cheapest fares. No wonder things change at 20 days out. Adobe similarly highlights that Honolulu doesn’t see fares spike as much close to departure, neglecting to mention that they are less frequently or significantly discounted further in advance.
So, yeah, we have another set of numbers purporting to explain in simple terms a much more complicated set of data. And not doing a particularly good job of it.
The reality is that there is no perfect formula for predicting what a good deal is, probably not even a very good one. You never know when a sale is going to come along and offer up $29 or $49 or $99 seats where they were multiples of that number just moments prior. And, perhaps more importantly, on any given flight each passenger likely paid a different amount. This reality is even more pronounced with network carriers carrying large numbers of travelers connecting over hubs. What’s more important is whether the fare you paid seems fair to you for the service rendered, especially after taking into account the variety of fees likely to show up after the ticket is purchased.