


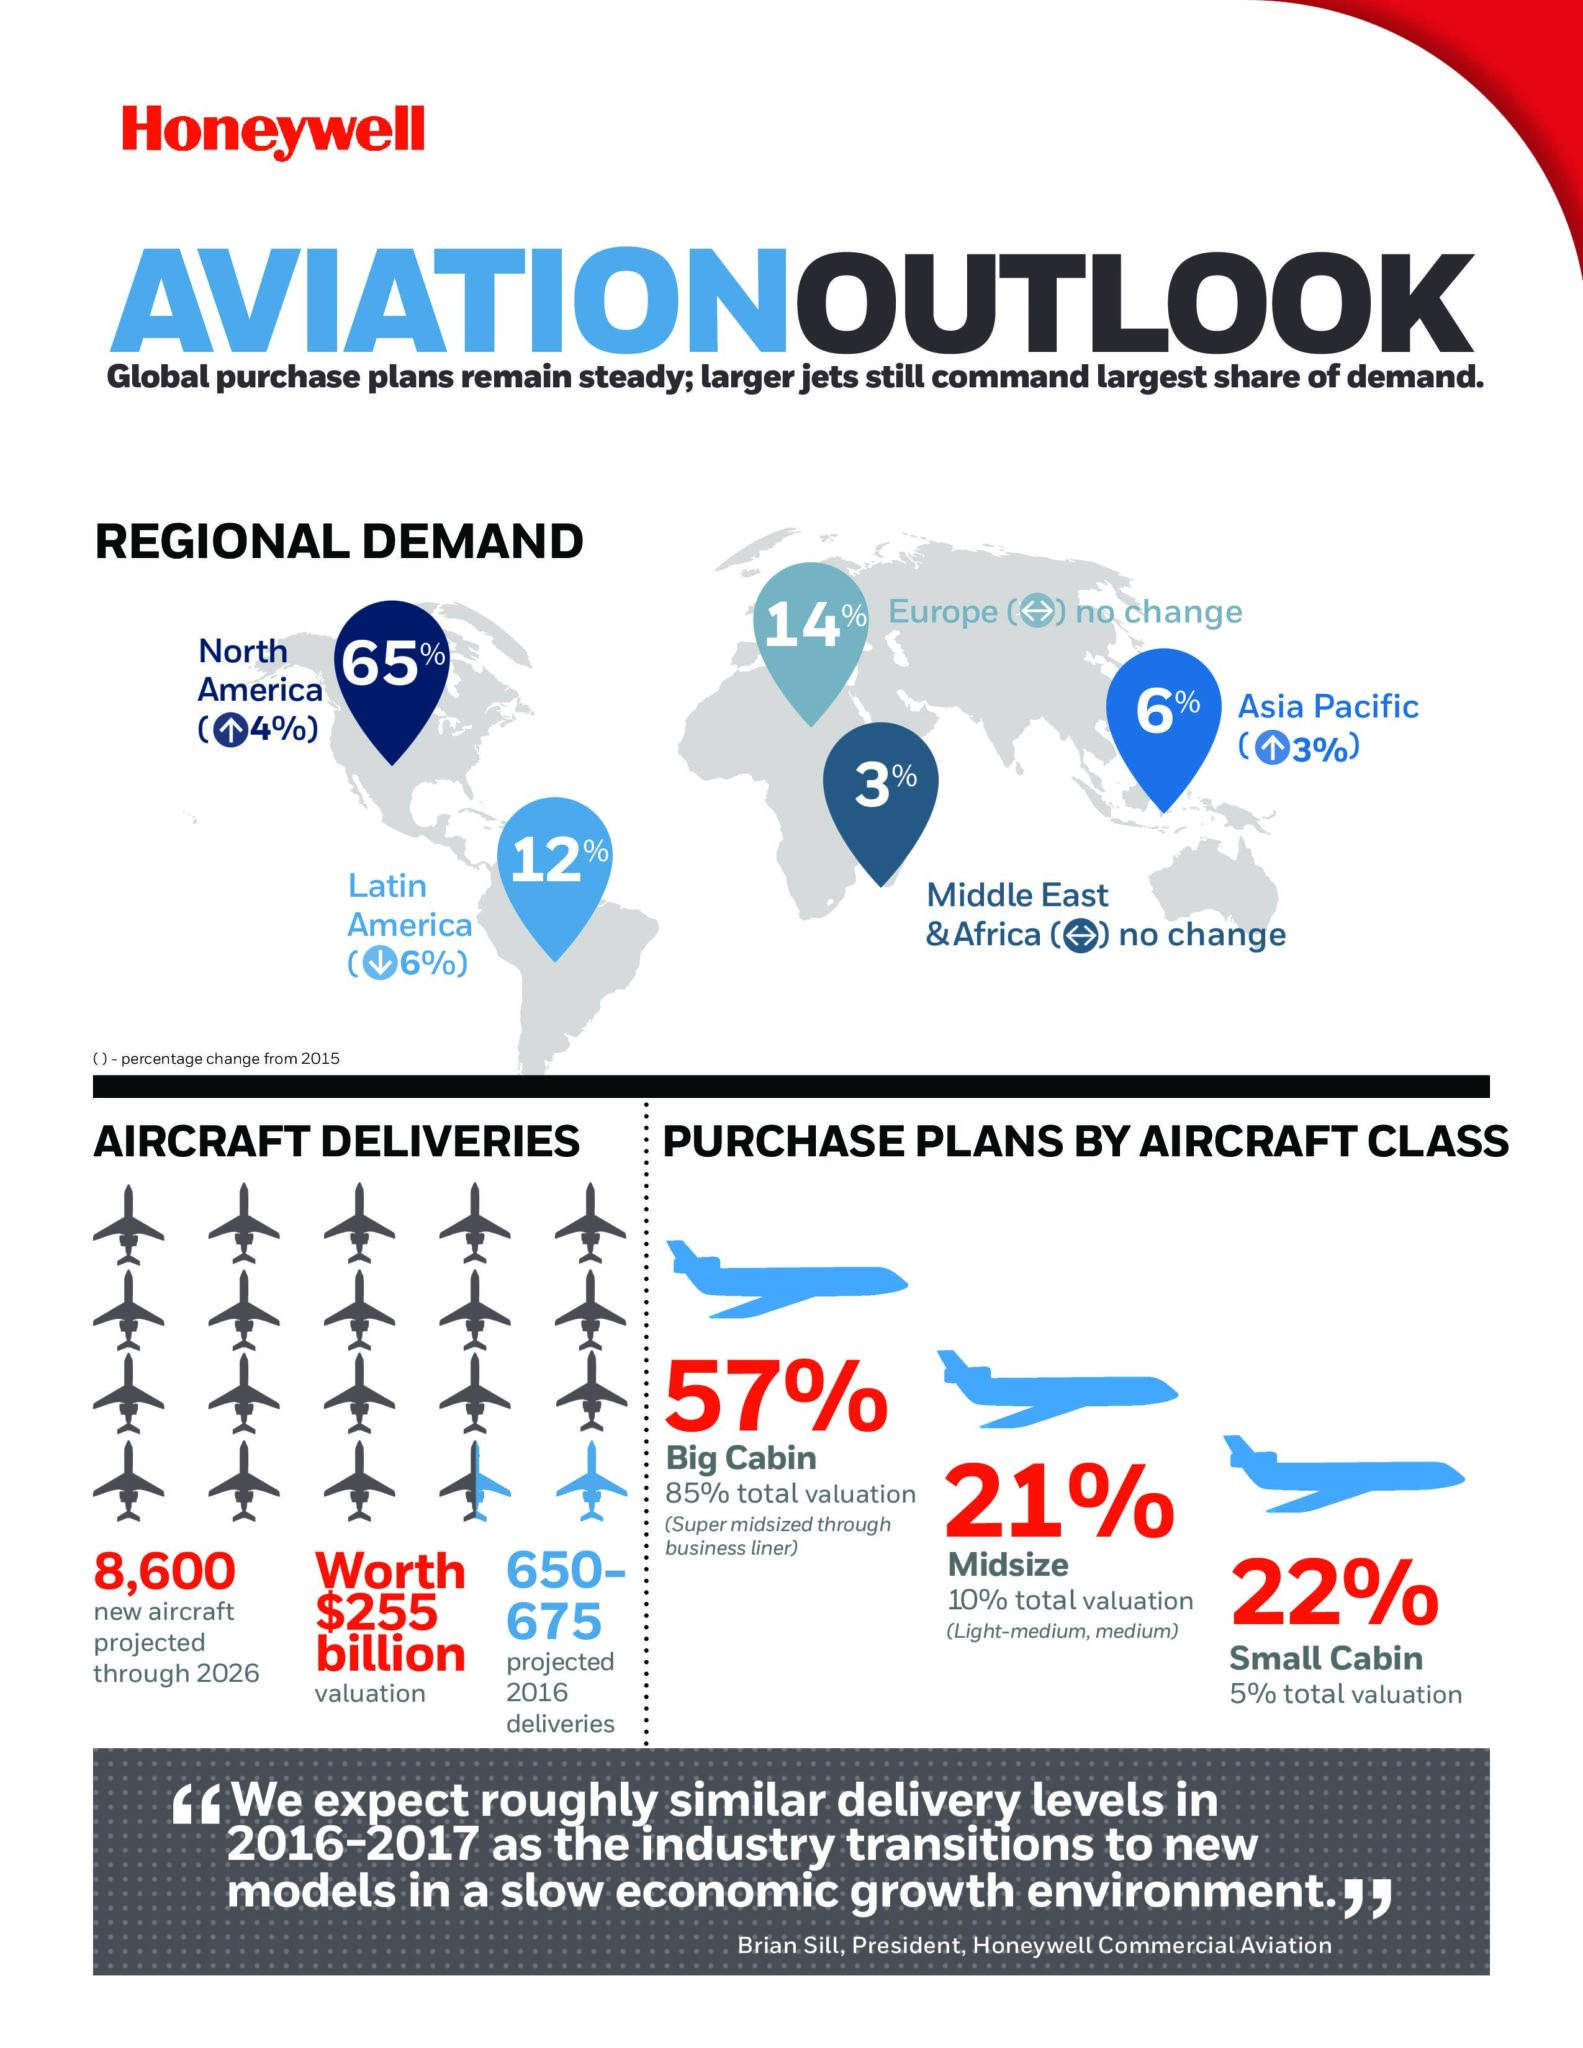
 The business aviation industry continues to face a slow near-term pace of orders due to a slow-growth economic environment across many global markets along with many political uncertainties, according to the 25th annual Global Business Aviation Outlook released today by Honeywell (NYSE: HON). The Global Business Aviation Outlook forecasts up to 8,600 new business jet deliveries worth $255 billion from 2016 to 2026, which represents a 6 to 7 percent reduction from the values noted in the 2015 forecast.
“We continue to see relatively slow economic growth projections in many mature business jet markets. While developed economies are generally faring better, commodities demand, foreign exchange and political uncertainties remain as concerns,” said Brian Sill, president, Commercial Aviation, Honeywell Aerospace. “These factors continue to affect near- term purchases, but the survey responses this year indicate there is improved interest in new aircraft acquisition in the medium term, particularly in the 2018–19 period. In the meantime, operators we surveyed this year indicated plans to increase usage of current aircraft modestly in the next 12 months, providing some welcome momentum to aftermarket activity, which has been flat recently.”
Key global findings in the 2016 Honeywell outlook include:
- Deliveries of approximately 650 to 675 new jets in 2016, a low- to mid-single-digit percentage decline year over year. The pullback in deliveries expected in 2016 comes on the heels of a small increase in 2015 and is largely due to slower order rates for mature models and a stabilization in fractional-usage type of aircraft deliveries.
- 2017 deliveries are projected to be slightly lower, reflecting transitions to new models slated for late 2017 and 2018 service entry.
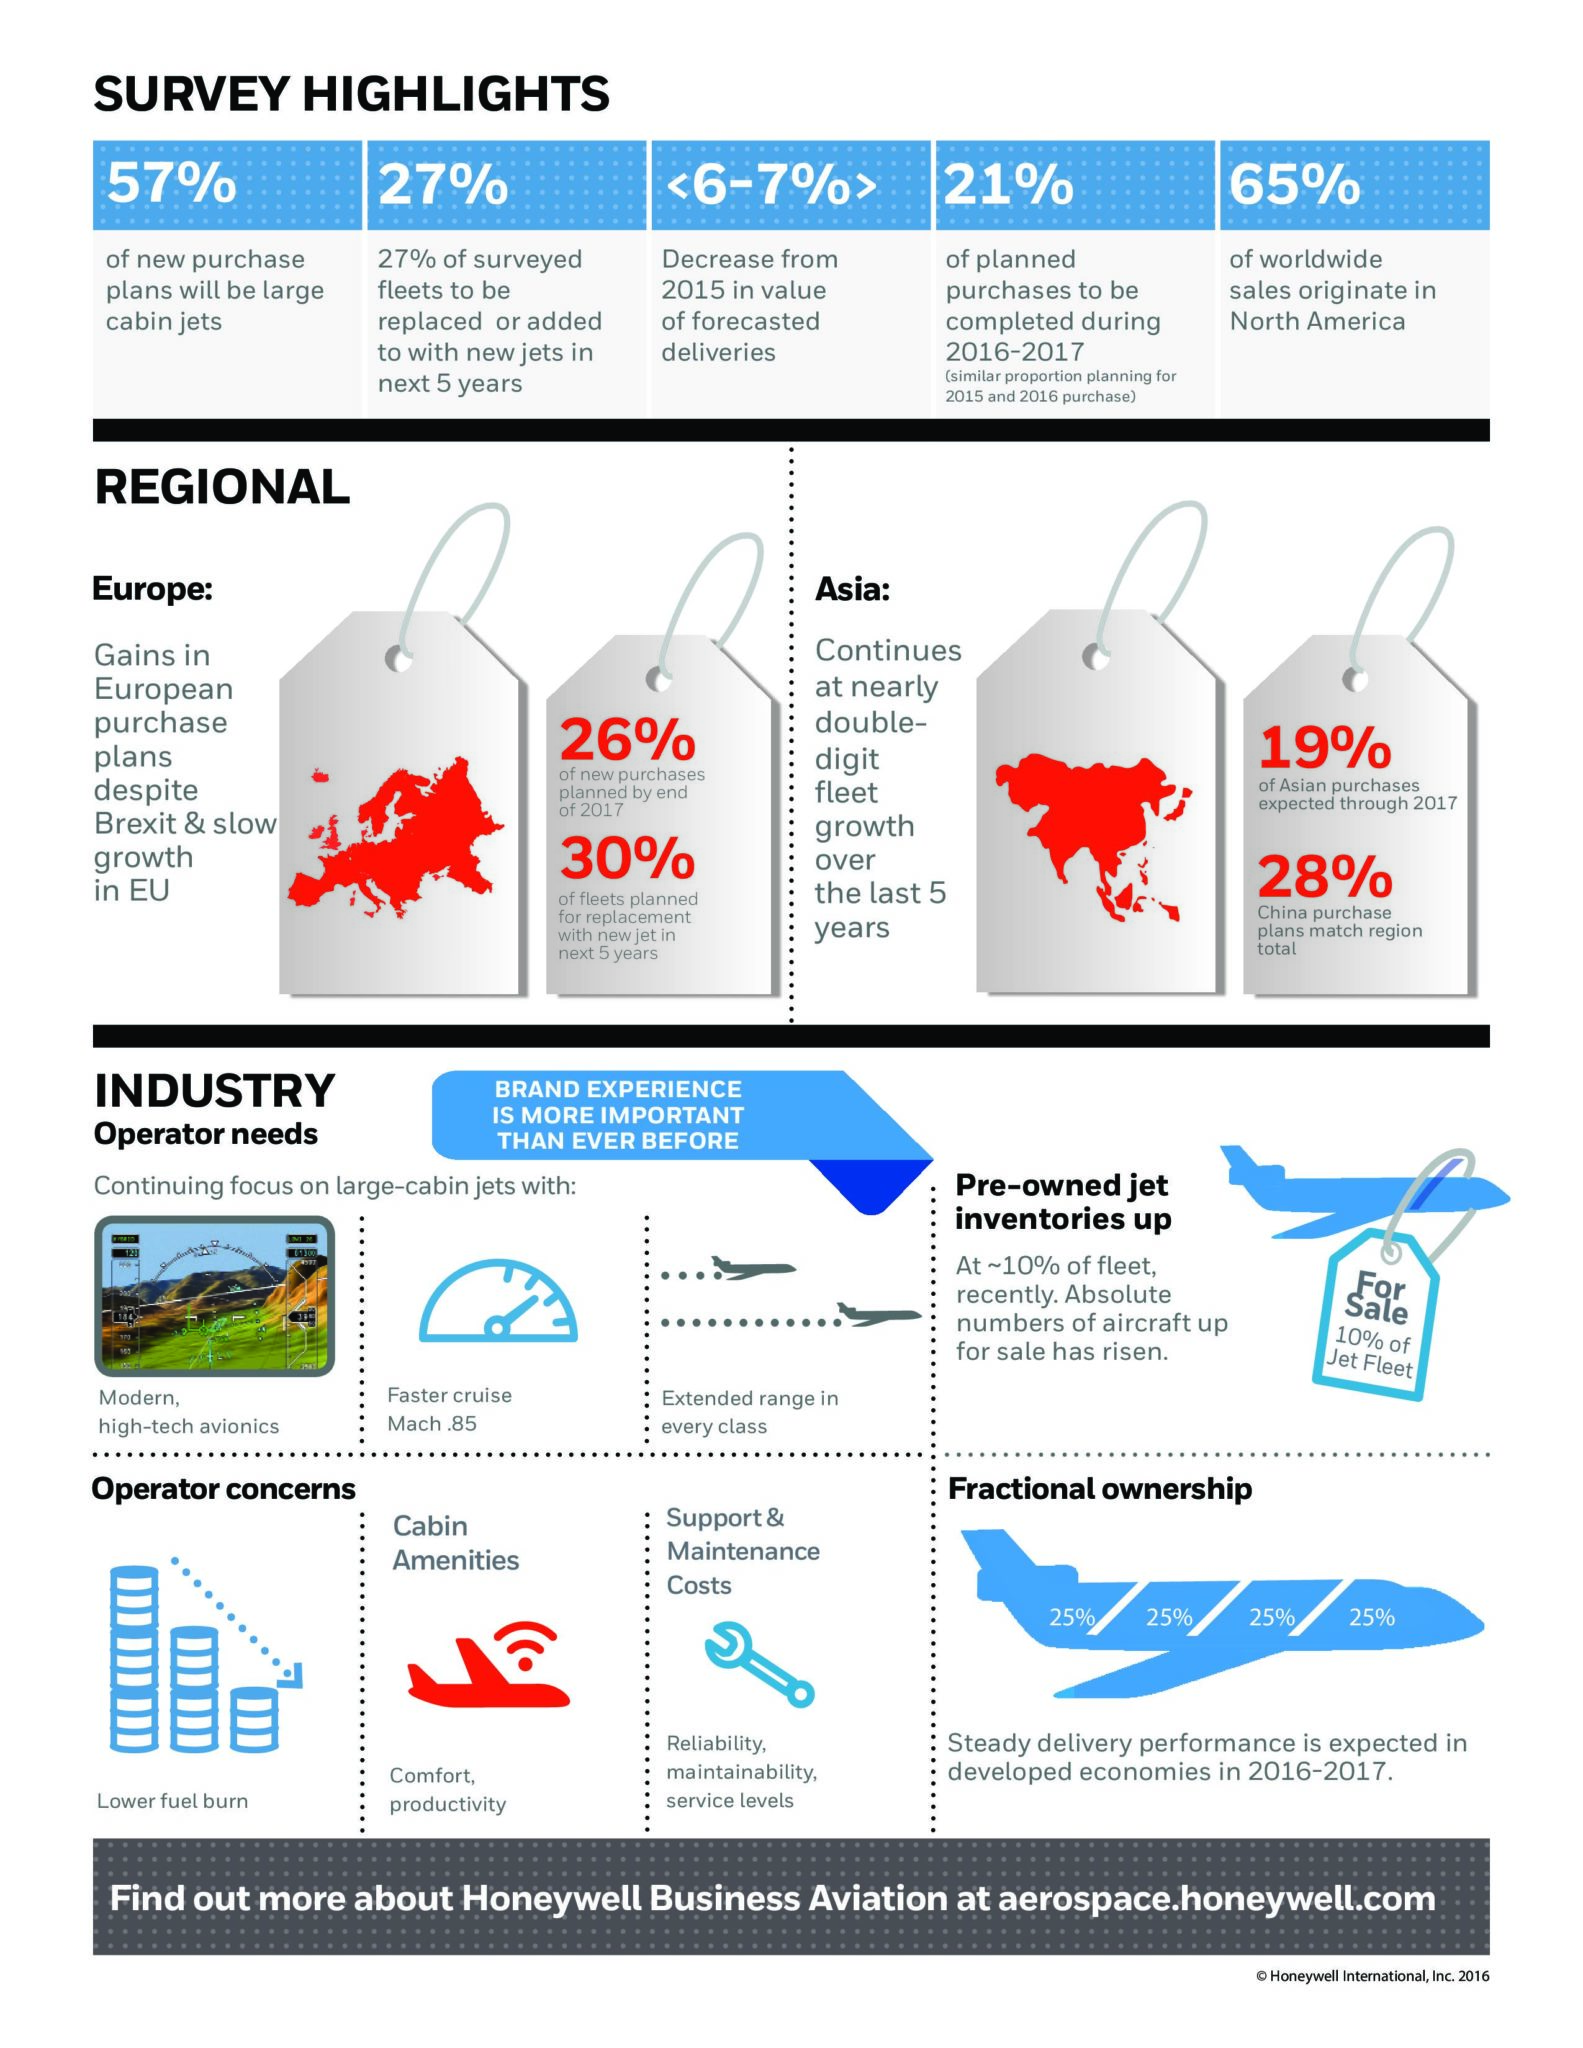
- Operators plan to make new jet purchases equivalent to about 27 percent of their fleets over the next five years as replacements or additions to their current fleet, an encouraging increase but one that is less than firm in timing.
- Of the total purchase plans for new business jets, 21 percent are intended to occur by the end of 2017, while 18 percent are scheduled for 2018 and 2019, respectively.
- Operators continue to focus on larger-cabin aircraft classes, ranging from super mid-size through ultralong-range and business liner, which are expected to account for more than 85 percent of all expenditures on new business jets in the next five years.
- The longer-range forecast through 2026 projects a 3 to 4 percent average annual growth rate despite the lower short-term outlook as new models and improved economic performance contribute to industry growth.
- Gains in five-year operator purchase plans are offset in the long-term forecast based on changes in new program timing, slower economic growth projections, and political and currency uncertainties, resulting in a moderately lower overall outlook.
Breakdown by Region
Brazil, Russia, India, China (BRIC) – Continued improvements in Chinese and Russian purchase plans compared with last year, coupled with slight gains in the larger Brazilian survey outlook, drive improved BRIC results.
- BRIC industry purchase plans rebounded off 2015 lows, reaching just over 32 percent in this year’s survey. The 32 percent rate returns the BRIC composite to a rate exceeding the world purchase plan rate. These purchase plans would reverse several years of decline.
- Brazil remained a bright spot by recording the strongest new aircraft purchase plans in the survey from a major aircraft market, though overall buying plans rose only slightly year over year.
- The combined BRIC countries’ near-term demand profile has shifted somewhat later in the forecast period this year, with 38 percent of intended new jet purchases scheduled for the next two years.
Asia Pacific – Despite ongoing regional tensions and government austerity initiatives, operator enthusiasm seems to be improving.
- Operators in Asia Pacific report new jet acquisition plans for 28 percent of their fleet over the next five years, roughly doubling from 2015 levels and reflecting optimism extending beyond the China market.
- Based on the improved level of purchase plans, Asia Pacific could garner up to a 6 percent share of global new jet demand over the next five years.
- Only 33 percent of Asian respondents plan to schedule their new purchases within the first two years of the five-year horizon.
Middle East and Africa – Improved purchase plans were reported, which was unexpected given another year of significant political upheaval and ongoing conflict in the region in tandem with only moderately improved oil prices.
- The share of projected five-year global demand attributed to the Middle East and Africa recovered to just below its historical range of 4 to 7 percent this year.
- In the Middle East and Africa, 21 percent of respondents said they will replace or add to their fleet with a new jet purchase, up from 16 percent last year but still below the overall world average. Considerable strength was present in the oil-producing nations and South Africa.
- Operators responding to the survey seem to be looking past current regional concerns, with potential buyers in the region scheduling their purchases sooner in the next five-year window compared with last year, with 49 percent of purchases planned before 2019. These improved survey responses appear at odds with the obstinate nature of the issues facing the region.
Latin America – 2016 results pulled back in line with the world average, but planned acquisitions remain more front-loaded than the world average. Slightly higher Brazilian purchase plans partially offset broader declines from other countries.
- Nearly 27 percent of the Latin America sample fleet is expected to be replaced or added to with new jet purchases — 2 to 3 points lower than last year’s survey. Some of the larger traditional markets in the region reset purchase plans to lower levels this year, particularly those linked strongly to commodities markets. Resilience in the Brazilian operator base helped offset some of the darker mood elsewhere in the region.
- With 47 to 48 percent of this region’s projected purchases planned to occur between 2016 and 2018, this indicates some potential deferral of purchases suggested last year for the 2015–2017 period, which was equally front-loaded.
- Based on the current purchase plan levels, Latin America’s 12 percent share of total projected demand slipped several points compared with a year ago.
North America – New aircraft acquisition plans in North America are very important given the region’s size and the unsettled conditions elsewhere around the world.
- An estimated 65 percent of projected demand comes from North American operators, up 4 points from the 2015 survey.
- New jet purchase plan levels rose 5 points in North America, the industry’s largest market, and helped drive the world average up to 27 percent.
- Current plan levels are now in alignment with the averages of the 2008−2012 period. Though buying plan rates are just under the overall world average, the fleet and operator base have expanded, supporting solid demand levels.
Europe – Despite operators still contending with sluggish growth and elevated political tensions, the uncertain effects of the Brexit vote, a refugee and migrant surge, and depreciated currencies, new jet purchase plans actually improved.
- Europe’s purchase expectations improved this year to 30 percent, in line with averages seen since 2009.
- Despite the improved new jet purchase plans. Europe’s share of estimated global five-year demand remained at 14 percent in the 2016 survey. This outcome is due in large part to the fact that the European fleet has not expanded in recent years. Many aircraft have migrated to other regions, resulting in an active fleet that is slightly lower despite an infusion of new jet deliveries.
- A comparison of the planned timing for European purchases indicates uneven proportions of demand in the next three years of the five-year window, with about 26 percent allocated through 2017 followed by a dip to 15 percent each in 2018 and 2019, suggesting a cautious approach to timing the replacement of expansion of the fleets with new acquisitions.
Used Jets and Flight Activity
Turning to used jets and flight activity, over the course of the past year, the pace of flight activity has not recovered. On a positive note, operators responding to the 2016 survey report they plan to increase aircraft usage in the next 12 months to a modest extent. With respect to the used jet market:
- Roughly 10 percent of today’s fleet is up for resale, down from a high of nearly 16 percent in 2009 but up from the low point achieved last year. Current levels are still within a reasonable aggregate level in light of the past decade’s history, but inventory levels are trending up. Meanwhile, asking prices continue to drift lower.
- In 2016, the total number of recent model jets (less than 10 years old) listed for resale rose significantly to about 675 aircraft, excluding personal jets and business liners. In proportion to the level of overall listings, the share of recent model jets for sale has risen noticeably.
- Operator respondents reduced their used jet acquisition plans by about 8 points, equating to 24 percent of their fleets in the next five years. All regions’ used jet purchase plans fell. The decline in used jet purchase plans clearly aligns with the expansion of used inventory for sale and continued price pressure on used jets.
- Weaker used aircraft purchase plans may slow the pace of aircraft upgrades.
Making an Impact on Business Decisions
This annual outlook reflects topical operator concerns but also identifies longer-cycle trends that Honeywell uses in its own product decision process. The survey has helped identify opportunities for investments in flight-efficiency upgrades, expanded propulsion offerings, innovative safety products, services, upgrades and enhanced aircraft connectivity offerings. It also contributes to Honeywell’s business pursuit strategy and helps position Honeywell consistently on high-value platforms in growth sectors.
Methodology
Honeywell’s forecast methodology is based on multiple sources including, but not limited to, macroeconomic analyses, original equipment manufacturers’ production and development plans shared with the company, and expert deliberations from aerospace industry experts. Honeywell also utilizes information gathered from interviews conducted during the forecasting cycle with over 1,500 nonfractional business jet operators worldwide. The survey sample is representative of the entire industry in terms of geography, operation and fleet composition. This comprehensive approach provides Honeywell with unique insights into operator sentiments, preferences and concerns, and provides considerable insight into product development needs and opportunities.
Supporting Resources
- Read more about Honeywell Aerospace on the Follow The Aero blog
- Like Honeywell Aerospace on Facebook
- Follow @Honeywell_Aero on Twitter
- Subscribe to Honeywell’s Corporate RSS feed
Honeywell Aerospace products and services are found on virtually every commercial, defense and space aircraft, and its turbochargers are used by nearly every automaker and truck manufacturer around the world. The Aerospace business unit develops innovative solutions for more fuel-efficient automobiles and airplanes, more direct and on-time flights, safer flying and runway traffic, along with aircraft engines, cockpit and cabin electronics, wireless connectivity services, logistics, and more. The business delivers safer, faster, and more efficient and comfortable transportation-related experiences worldwide. For more information, visit www.honeywell.com or follow us at @Honeywell_Aero and @Honeywell_Turbo.
Honeywell (www.honeywell.com) is a Fortune 100 diversified technology and manufacturing leader, serving customers worldwide with aerospace products and services; control technologies for buildings, homes and industry; turbochargers; and performance materials. For more news and information on Honeywell, please visit www.honeywell.com/newsroom.
 Featured image credited to istock.com/JakeOlimb